

Packaging lines rarely break in one big way. They lose time little by little.
A conveyor pauses. A sensor trips. A bottle tips. An operator clears it. The line restarts. Production continues. Nothing looks serious. By the end of the shift, a lot of capacity is gone.
These short stops feel normal in many facilities. Teams clear them fast and move on. Because nothing breaks, the loss is rarely logged as downtime. Yet these tiny pauses quietly drain productivity.
This article shows how small stops add up, why this hurts California manufacturers, and what smooth lines do differently.
Why “Invisible Downtime” Costs More in California
California makes small losses very expensive.
- Labor costs are high, so every lost minute matters.
- Compliance rules slow troubleshooting and restarts.
- Frequent SKU changes cause more brief stops.
- Automated lines have many sensors that can pause the line.
When minutes are costly, short stops become a real business problem.
Where Micro-Stoppages Usually Start
1) Unstable infeed
Uneven spacing, tipped bottles, or poor orientation can trigger downstream pauses.
2) Overly strict sensors
Poor placement or aggressive settings create nuisance stops that are not truly needed.
3) Speed mismatches
When machines run at different real speeds, one station slows the entire line.
4) Slow restarts
After each stop, the line needs time to stabilize — multiplying the real loss.
Takeaway: These are not maintenance breakdowns. They are system behavior problems.
How Small Stops Become Big Losses
One 10-second stop feels small. Ten in an hour are not.
How micro-stoppages add up in one shift
| Event | Frequency | Time lost per event | Total loss per shift |
|---|---|---|---|
| Short sensor fault | 8 per hour | 8 seconds | 32 minutes |
| Minor jam clear | 4 per hour | 15 seconds | 24 minutes |
| Restart stabilization | 6 per hour | 10 seconds | 36 minutes |
| Total hidden loss | — | — | ~90 minutes |
Most facilities never record this as downtime, yet nearly two hours of production disappear.
Why Standard Downtime Tracking Misses the Problem
Many California plants track only major breakdowns. They typically miss:
- Stops under 30 seconds
- Restart delays
- Small operator interventions
- Temporary speed cuts
Dashboards look fine — but real output is still lower than it should be.
What gets measured vs what truly matters
| What is commonly tracked | What usually drives losses |
|---|---|
| Major breakdowns | Frequent micro-stops |
| Scheduled maintenance | Restart delays |
| Planned downtime | Operator micro-interventions |
| Peak line speed | Real average throughput |
How Line Design Amplifies Small Problems
When lines are tightly linked, one small issue spreads quickly:
- A brief infeed pause starves downstream machines
- A minor jam forces a full line stop
- Slow restart logic delays every station
- Operators lower speed “just in case”
The line keeps running — but it underperforms all day.
What Low-Friction Lines Look Like
High-performing lines share four traits:
- Stable container flow — fewer tips and misfeeds
- Well-tuned sensors — fewer nuisance stops
- Balanced machine speeds — no chronic bottlenecks
- Coordinated restarts — fast, smooth recovery
These lines treat small disruptions as routine, not disruptive.
How Accutek Reduces Hidden Downtime in California
Accutek located at Vista, California treats downtime as a system issue, not just a packaging machine problem.
Key design priorities
- Proper accumulation to absorb brief stops
- Better sensor placement to reduce false trips
- Speed coordination based on real production data
- Smooth restart sequences
Accutek strategies vs downtime drivers
| Downtime driver | Accutek response | Facility outcome |
|---|---|---|
| Infeed instability | Better container handling | Fewer stops |
| Nuisance faults | Smarter sensor logic | More stable runs |
| Speed mismatch | Line-wide coordination | Steady throughput |
| Slow recovery | Structured restart | Shorter delays |
Result: more capacity without buying new machines.
Why “Run It Slower” Is a Weak Fix
Slowing the line reduces jams — but permanently locks in lost output.
A stronger approach:
- Find where micro-stops originate
- Improve flow, sensors, and restarts
- Raise speed only after stability improves
Rule: Speed should come from stability — not replace it.
What to Measure Instead
Track four metrics:
- Stops under 30 seconds
- Time to stabilize after restarts
- Frequency of operator interventions
- Real throughput per hour
When these improve together, true capacity returns.
Key Takeaways
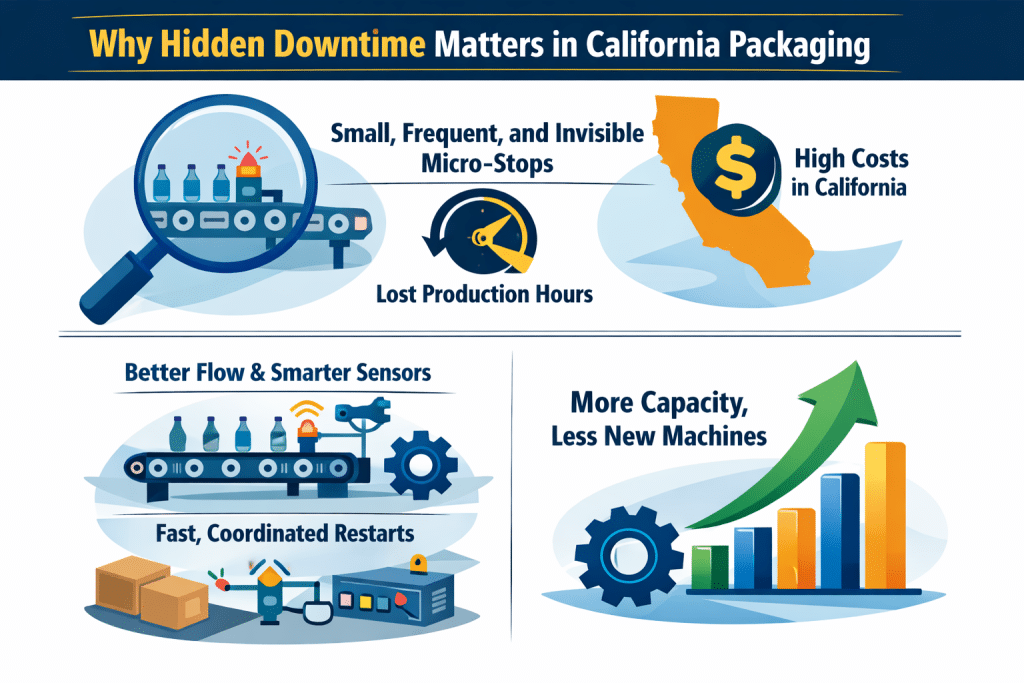
- The costliest downtime is often small, frequent, and invisible.
- Micro-stops can erase hours of production each shift.
- California costs make these losses even worse.
- Better flow, smarter sensors, and coordinated restarts reduce stops.
- Fixing hidden downtime often adds more capacity than buying new machines.
